Skip to main content Skip to footer

Every season, our team visits dozens of factories across China and Vietnam on behalf of clients. We see the same problem repeat itself: a supplier quotes a jaw-dropping annual capacity figure, the buyer places a large order, and then delays pile up three months in.
Most factories in China state a capacity figure that reflects their theoretical maximum — not their realistic, sustained output. The only way to verify the claim is to combine a physical audit with document checks, third-party inspection reports, and independent supplier interviews. No single data point is enough on its own.
If you rely on a salesperson's word alone, you are taking a blind risk. The sections below give you a step-by-step framework to cut through the noise.
What Production Records Should I Ask for Before I Trust a Factory's Capacity Claim?
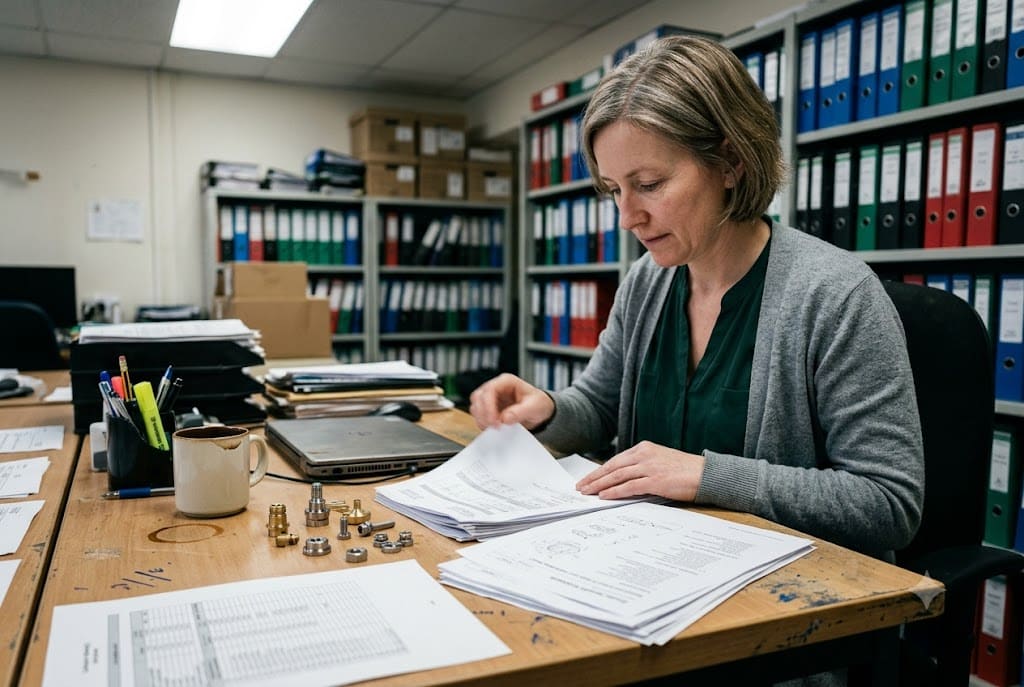
Before we arrange a factory visit for a client, our sourcing team always requests a document package first. Paper trails are hard to fake consistently, and gaps in the records are just as revealing as the records themselves.
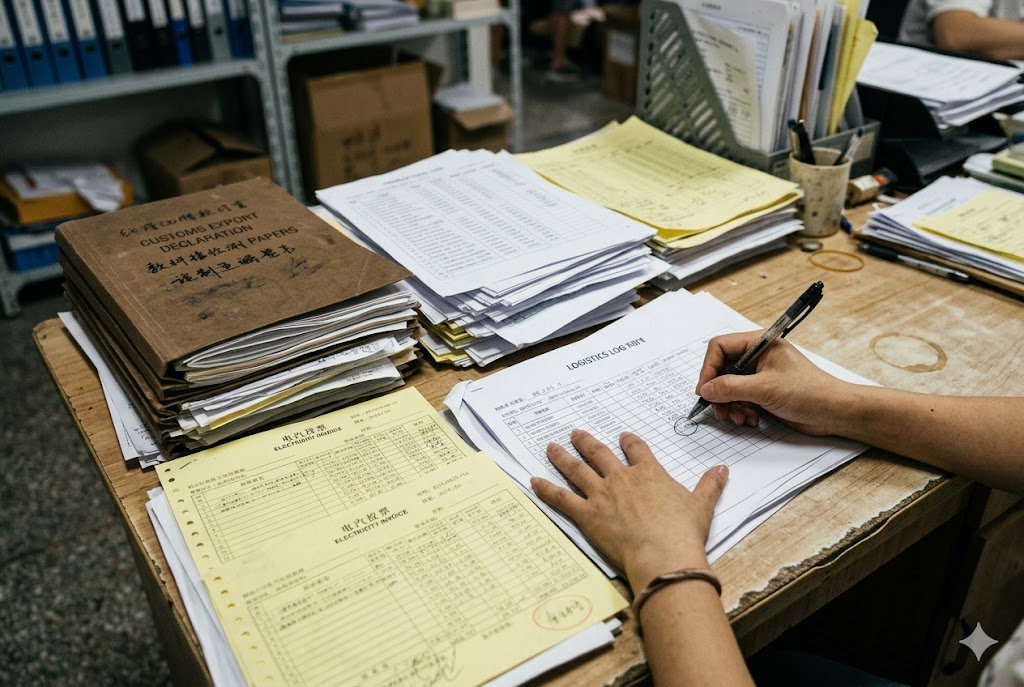
To verify a factory's capacity claim, request at least three types of production records: monthly output logs for the past 12 months, customs export records or freight-forwarder shipping histories, and utility invoices covering the same period. Cross-reference all three. If the numbers align, the claim is likely credible.
Monthly Output Logs
Ask for internal production reports broken down by month. A trustworthy supplier will provide these without hesitation. Look for consistency. A factory claiming 500,000 units per year should show roughly 40,000 units per month, with some seasonal variation. Wild swings — say, 80,000 one month and 5,000 the next — suggest either poor planning or fabricated data.
Customs Export Records
China's customs system generates official export declarations for every shipment. Ask the supplier to share their export records for the past year. This is a hard, document-backed lower bound on actual production. A factory cannot export goods it has not made. If the total shipped volume is significantly lower than the stated annual capacity, you have found your first red flag.
Utility Invoices
This is the check most buyers never think to request. Energy use scales predictably with machine-hours. A factory running high-volume output will have electricity invoices to match. Compare the invoiced kilowatt-hours against the factory's stated number of production lines and shifts. Understanding CNC machining energy consumption 1 benchmarks is particularly useful here. The table below shows a rough benchmark for common mechanical part manufacturing processes.
| Process Type | Typical kWh per Shift per Machine | Expected Monthly kWh for 10 Machines (2 Shifts) |
|---|---|---|
| CNC Machining | 15–25 kWh | 9,000–15,000 kWh |
| Stamping / Pressing | 10–20 kWh | 6,000–12,000 kWh |
| Injection Molding | 20–40 kWh | 12,000–24,000 kWh |
| Welding | 8–15 kWh | 4,800–9,000 kWh |
If a factory claims to run 20 CNC machines across two shifts but their monthly electricity bill suggests under 5,000 kWh of consumption, something does not add up. Push for an explanation before you proceed.
Business Registration Records
One more check that costs nothing: look up the factory on China's National Enterprise Credit Information Publicity System 2 (NECIPS). A factory legally registered only as a trading company cannot legitimately claim its own manufacturing capacity. This single check has saved our clients from placing orders with brokers who presented themselves as factories.
How Can I Tell If a Supplier Is Overpromising Output Just to Win My Order?
We have walked factory floors in Guangdong, Zhejiang, and Jiangsu where the showroom was immaculate but the production hall behind it was half-empty. Sales teams are trained to impress. The signs of overpromising are there if you know where to look.
A supplier is likely overpromising if their stated capacity significantly exceeds the mathematical output their equipment, labor, and floor space can physically support. Three warning signs: they hesitate on live video calls, their litigation history includes late-delivery disputes, and their raw material suppliers report smaller or less frequent orders than the claimed volume would require.

The Live Video Call Test
Request an unscripted, live video call — not a pre-recorded tour. Ask the contact to pan the camera slowly across active production floors, show machine nameplates (which display model number and rated output), and hold the camera up to the factory signboard. Legitimate manufacturers do this without hesitation. Brokers stall, switch to recorded footage, or claim the factory floor is "too noisy."
Check Litigation History
Search the factory's name using the China court records lookup guide 3 covering China Judgements Online (中国裁判文书网) and the Supreme People's Court enforcement database. These are publicly accessible. Repeat breach-of-contract or late-delivery suits from multiple buyers are a reliable, court-verified signal that the factory routinely fell short of promised output. One dispute may be a one-off. Three or more follow a pattern.
Do the Production Math Yourself
This is the most powerful check our team runs. The formula is straightforward:
Theoretical Max Output = Production Lines × Units per Cycle × Cycles per Shift × Shifts per Day × Working Days per Year
| Variable | Example Value |
|---|---|
| Production lines | 8 |
| Cycle time per unit | 4 minutes |
| Units per shift (480 min ÷ 4) | 120 |
| Shifts per day | 2 |
| Working days per year | 280 |
| Theoretical annual max | 537,600 units |
If the factory claims 800,000 units per year but the physical math caps them at 537,600, someone is not being honest. Apply a realistic efficiency factor of 70–80% to account for downtime, changeovers, and defects, and the actual sustainable output is closer to 376,320–430,080 units. The concept of Overall Equipment Effectiveness (OEE) 4 formalizes exactly this gap between theoretical and actual output.
Interview Their Raw Material Suppliers
Contact two or three of the factory's tier-1 raw material suppliers independently. Ask about order frequency and volumes. Suppliers who actually fill large, recurring orders will confirm this. Take those volume figures, apply standard material yield rates for the product category, and back-calculate the factory's plausible finished-goods output. If the math contradicts the stated capacity, you have your answer.
Why Does Real Production Capacity Matter for My Delivery Reliability?
Our clients do not just import parts. They supply assembly lines. A two-week delivery delay for them does not mean a two-week inconvenience — it can mean a production stoppage for their downstream customer and a compensation claim that wipes out the margin on the entire order.
Real production capacity determines delivery reliability because a factory operating near or above its true ceiling has no buffer for order surges, equipment failures, or quality rework. When a supplier accepts an order they cannot fulfill at peak, your order gets deprioritized in favor of their larger or longer-standing clients.

What Happens When Capacity Is Overcommitted
When a factory accepts more orders than its physical capacity allows, it enters a prioritization queue. Your order's position in that queue depends on factors that have nothing to do with your contract. These include the size of the competing client's historical orders, payment terms already extended, and personal relationships between the factory owner and the competing buyer. You rarely know where you stand until a delay is already happening.
The Cost of a Delivery Failure
Research on supplier delivery penalties and emergency freight costs 5 documents how quickly a single production stoppage can become a seven-figure liability. The table below shows common downstream costs that our US-based clients have reported when a supplier delivery failure caused a production stoppage.
| Cost Category | Typical Impact |
|---|---|
| Line stoppage penalty from their customer | $5,000–$50,000 per day |
| Emergency air freight to source replacement parts | 4–8× sea freight cost |
| Rescheduling and overtime labor at the assembly plant | $10,000–$30,000 per incident |
| Reputational cost with the downstream customer | Hard to quantify; often contract-ending |
These figures make clear why a $0.50 per unit saving from an unverified supplier can become a six-figure liability in the wrong quarter. The choice between air freight and sea freight under deadline pressure 6 is one buyers are forced to make when supplier capacity fails — and the cost differential is severe.
Capacity Buffer Is Your Insurance Policy
A factory running at 60–70% of its true capacity has room to absorb a rush order, a quality-related rework batch, or a machine breakdown without pushing your timeline. A factory already running at 95% of true capacity has no such room. Verified capacity data lets you make that judgment before you sign a contract, not after a delay notification arrives.
Can I Estimate a Factory's Real Capacity from Its Equipment and Labor Setup?
Yes — and this is something our engineers do on every factory visit we conduct for a client. You do not need to be an industrial engineer to run a basic capacity estimate. You need a notepad, a stopwatch app on your phone, and the willingness to ask direct questions on the floor.
You can estimate a factory's real capacity by counting active production lines, timing a sample of machine cycles, confirming the number of daily shifts with floor workers directly, and multiplying those figures against annual working days. Apply a 70–80% efficiency factor to arrive at a realistic sustainable output figure.
Step 1: Count Active Lines, Not Total Lines
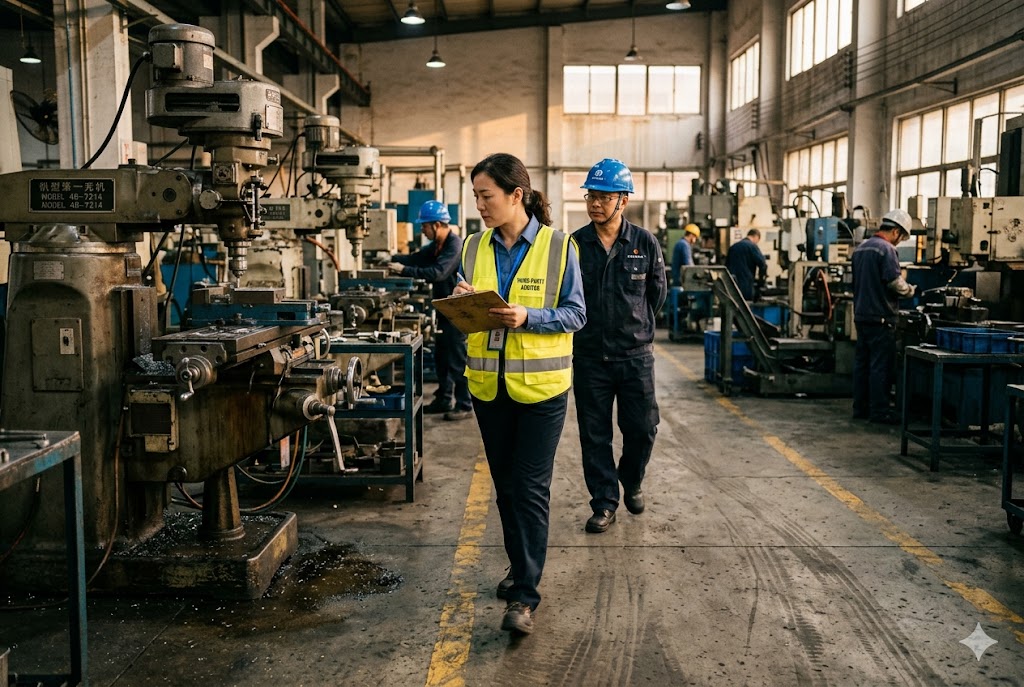
Ask to see the production floor — all of it, not just the area the sales manager guides you toward. Count the number of machines that are actively running, not the machines parked or covered with dust. Some factories quote capacity based on total installed machinery, including equipment that has not run in months. Only active, maintained equipment contributes to real output.
Step 2: Time the Cycle
Use your phone to time how long one machine takes to complete one production cycle. Do this for several machines and average the results. This is your per-unit cycle time. Be aware that operators sometimes run faster when being observed; actual cycle times during unsupervised production are typically 5–15% slower.
Step 3: Confirm Shifts with Workers, Not Management
Ask a floor worker — not the factory manager — how many shifts the facility runs each day and how many days per week production actually runs. Management will almost always say three shifts, six days. Workers will tell you the truth. Cross-check this against dormitory capacity if the factory provides worker housing.
Step 4: Apply the Efficiency Factor
No factory runs at 100% of theoretical maximum. The OEE benchmark data for manufacturing 7 confirms that most manufacturers operate between 60% and 85% of theoretical capacity. The table below shows realistic efficiency ranges by production type for mechanical parts manufacturing.
| Production Type | Realistic Efficiency Factor |
|---|---|
| CNC machining (multi-axis) | 65–75% |
| Stamping and sheet metal | 70–80% |
| Injection molding | 75–85% |
| Manual assembly | 60–70% |
| Welding (semi-automated) | 70–78% |
Multiply your theoretical maximum by the applicable efficiency factor. The result is a reasonable estimate of sustainable annual output. Compare this to what the factory claims. A gap of more than 20% deserves a direct conversation before you proceed.
Step 5: Commission a Third-Party Audit for High-Stakes Orders
For orders above a threshold that matters to your business, commission a third-party on-site factory audit 8 from firms such as SGS factory audit services 9, Bureau Veritas, TÜV, or AsiaInspection. Their auditors physically count production lines, measure floor area, inspect machine condition, and cross-reference findings against the factory's stated capacity. They also benchmark the factory's floor area against industry-standard output-per-square-meter ratios. A garment factory claiming 2 million units per year from 1,000 m² of floor space, for example, implies a physical throughput density that standard industrial layouts simply cannot support. The same principle applies to mechanical parts. Before engaging any audit firm, it is worth consulting the China trade register 10 to confirm the factory's legal registration status and unified social credit code independently.
Conclusion
Verifying a factory's production capacity is not a single task — it is a layered process combining document checks, physical observation, independent interviews, and where stakes are high, third-party audits. A credible supplier will welcome every one of these steps.
Footnotes
1. Explains how CNC machine energy consumption scales with shifts and load, useful for cross-checking utility invoices. ↩︎
2. Complete guide to China's official NECIPS platform for verifying a company's legal registration type. ↩︎
3. How to search Chinese court records to uncover supplier litigation and enforcement history. ↩︎
4. Explains OEE, the standard metric that quantifies the gap between theoretical and actual production output. ↩︎
5. Documents real-world supplier delivery penalties and emergency freight costs in automotive supply chains. ↩︎
6. Explains how forwarders assess total cost of failure when choosing between air and sea freight under deadline pressure. ↩︎
7. OEE benchmark data showing most manufacturers operate between 60–85% of theoretical capacity. ↩︎
8. Practical guide to factory audits in China, covering scope, cost, and leading third-party audit providers. ↩︎
9. SGS factory audit service overview covering production capacity verification and compliance checks. ↩︎
10. Step-by-step guide to using China's official GSXT trade register to verify supplier legal status and USCC. ↩︎