Skip to main content Skip to footer
Every year, we watch buyers receive shipments that look right on the outside but fail the moment they hit the production floor. Tolerances are off. Parts don't fit. The supplier swears the process was fine. We've seen this pattern enough times to know the real problem starts long before the shipment leaves China.
Process stability in CNC machining means the supplier's machines, tools, operators, and measurement systems work together to produce consistent dimensions across every part in a run. You can confirm it by requesting SPC charts, Cpk values above 1.33, Gage R&R studies, and traceability records that link each batch to a specific machine, operator, and date.
If you don't verify these before mass production starts, you are betting your supply chain on trust alone. The sections below give you the exact questions to ask and the data to request.
What Signs Show That a Supplier's Machining Process Is Stable?
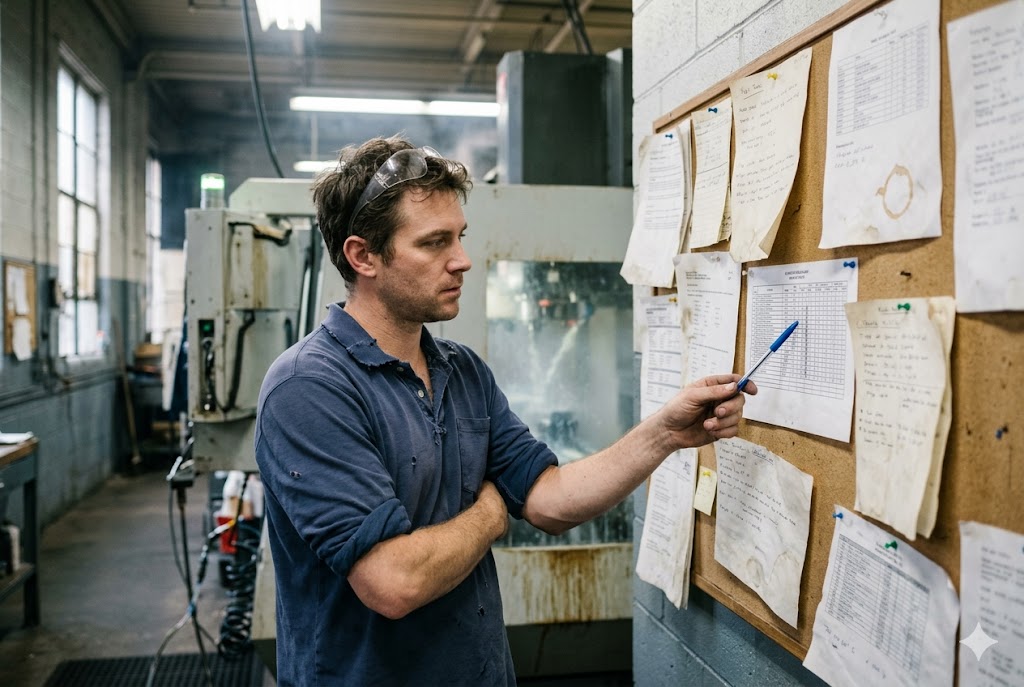
When we visit supplier factories before recommending them to clients, the first thing we look at is not the machines. It is the data on the walls and in the folders. A stable process leaves a paper trail.
A stable machining process shows all measurement points within control limits on SPC charts, no visible trends or shifts across a production run, Cpk values at or above 1.33 on critical dimensions, and a workforce that can explain what they do when a point goes out of control.
What SPC Charts Actually Tell You
Statistical Process Control 1 (SPC) is the discipline behind the most common monitoring charts used in precision manufacturing. The most common charts are X-bar and R charts 2. The X-bar chart tracks average dimension values for small subgroups of parts. The R chart tracks the range of variation within each subgroup.
A healthy SPC chart looks calm. Points scatter randomly within the upper and lower control limits. There are no long runs of points above or below the center line. There are no trends moving steadily upward or downward.
An unhealthy chart tells a clear story. A gradual upward trend usually means tool wear. A sudden shift often means a tool change, a machine adjustment, or an operator swap. Clustering near the control limits means the process is running close to its edge.
Here is what to look for at a glance:
| Signal on SPC Chart | Likely Cause | What to Ask the Supplier |
|---|---|---|
| Gradual upward trend | Tool wear | Show me your tool life records |
| Sudden shift | Tool change or machine adjustment | Was this logged in your change control system? |
| Points outside control limits | Process out of control | What corrective action was taken? |
| All points near center line | Process well controlled | Can I see the last three production lots? |
| No chart available | No real-time monitoring | How do you catch problems mid-run? |
If a supplier cannot show you SPC charts, they are doing end-of-line inspection only. That means defects are caught after they are already made — if they are caught at all.
Cpk: The Number That Predicts Batch Quality
The process capability index (Cpk) 3 measures how well the process is centered inside the tolerance band and how much natural variation it has. A Cpk of 1.00 means the process just fits inside the tolerance with almost no room for error. A Cpk of 1.33 means there is a meaningful buffer. A Cpk of 1.67 means the process is tightly controlled and suitable for safety-critical or precision features.
Always request Cpk values from a minimum of 50 consecutively machined parts. A Cpk calculated from 10 or 15 parts is statistically unreliable. It cannot predict what happens across a full production lot of 500 or 5,000 parts.
| Cpk Value | What It Means | Acceptable For |
|---|---|---|
| Below 1.00 | Process cannot consistently meet tolerance | Not acceptable for production |
| 1.00 – 1.33 | Process barely fits; high defect risk | Rework only; requires improvement plan |
| 1.33 – 1.67 | Adequate capability with buffer | Standard production features |
| 1.67 and above | High capability; tight control | Safety-critical and tight-tolerance features |
Ask the supplier to show Cpk values for every critical dimension listed on your drawing. If they give you one single Cpk number for the whole part, that is not enough. Each critical dimension needs its own calculation.
Operator and Shift Consistency
One sign of real process stability is that results do not change significantly when the operator changes or the shift rotates. Ask the supplier to overlay SPC data from different shifts on the same chart. If you see clear shifts in the average dimension at shift change times, the process depends too much on individual operator skill and not enough on controlled setup parameters.
Should I Review Capability Data Before Mass Production?
Before we authorize any supplier to move into full production volume on a client's parts, we require one specific step that many buyers skip entirely. It costs a few days. It has saved clients from disasters that would have cost weeks and thousands of dollars.
You should always review capability data before mass production. Request a bridge run of 30 to 50 consecutively machined parts to generate initial SPC baseline data. Combine this with a Gage R&R study to confirm the measurement system is trustworthy. Do not approve full production until both datasets meet your acceptance criteria.

The Bridge Run: Your Pre-Production Baseline
A bridge run is not a sample. It is not the same as a first article inspection 4. Its only purpose is to measure natural process variation under real operating conditions, using real production tooling, on the actual machines scheduled for your job.
You need 30 to 50 consecutively machined parts. Measure every critical dimension on every part. Plot the data on SPC charts. Calculate Cpk for each critical dimension. This gives you a reliable baseline before you commit to full production volume.
If the bridge run shows unstable control charts or Cpk values below 1.33, you have found the problem before it scales up to thousands of parts. That is the entire point.
Gage R&R: Trusting the Measurement System
Here is a problem many buyers never think about. A measurement system with high variation can make an unstable process look stable. If the supplier's gauge has poor repeatability, it will report dimensions within tolerance even when parts are actually out of tolerance.
Gage R&R (Repeatability and Reproducibility) 5 measures how much of the total measurement variation comes from the gauge itself and from operator differences, versus actual part-to-part variation.
The rule is simple:
| GR&R as % of Tolerance Range | Verdict |
|---|---|
| Below 10% | Acceptable — measurement system is reliable |
| 10% – 30% | Marginal — may be acceptable depending on risk level |
| Above 30% | Not acceptable — measurement data cannot be trusted |
Ask the supplier to run a GR&R study with at least two operators and 10 parts, measured three times each. If they cannot produce this, their inspection results are opinions, not data.
Thermal Drift and Machine Warm-Up
CNC machines expand as they heat up. During the first one to two hours of operation, thermal growth in the spindle and axis ball screws can shift dimensions by 0.005 to 0.020 mm. For tight-tolerance parts, that is enough to push dimensions out of specification.
A process-stable supplier will have a documented warm-up protocol. Machines run for a set time before production parts are cut. Measurements are taken during warm-up to verify the process has stabilized. SPC data from a well-run shop will show a settling period at the start of each shift followed by stable variation once the machine reaches operating temperature.
Ask to see SPC charts that include the first 30 minutes of each shift. If the data shows a clear drift during that window and the supplier has no warm-up protocol, that drift is going directly into your production parts.
How Can Trial Runs Help Me Assess Process Consistency?
Our team has used trial runs as a qualification gate on every new supplier relationship we build. Not as a formality. As a genuine stress test. The trial run is where a supplier either proves their process or reveals its weaknesses.
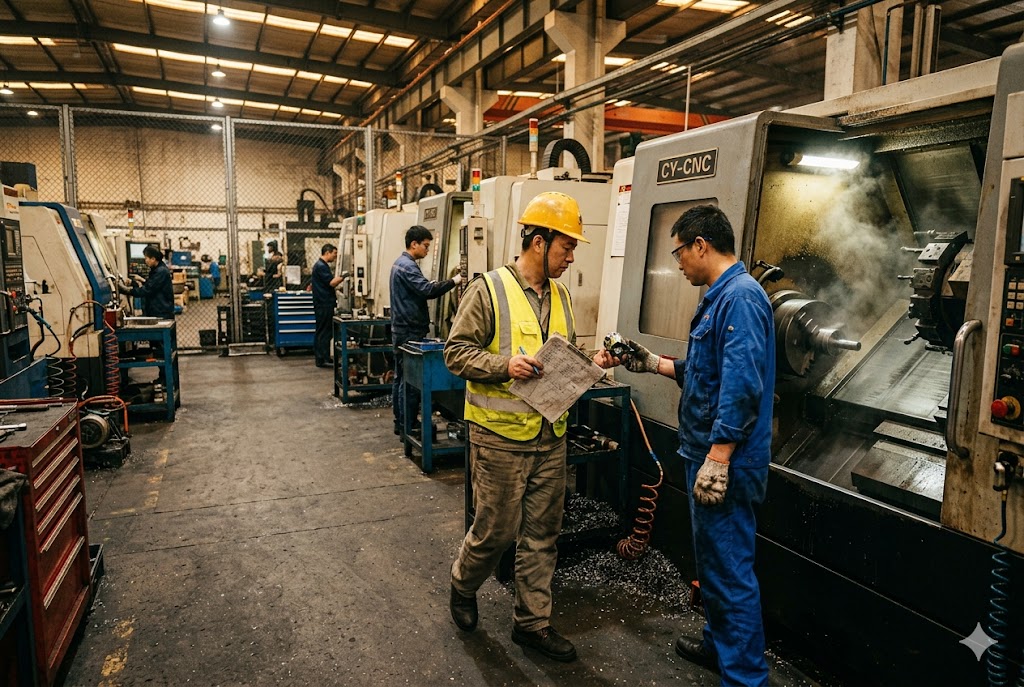
Trial runs assess process consistency by generating real production data under normal operating conditions. A trial run of 30 to 50 parts should produce SPC charts, Cpk values, and in-process inspection records that confirm the process performs consistently across the full run — not just at the start.
What to Measure During a Trial Run
Do not just measure the first part and the last part. That tells you almost nothing. Measure parts at regular intervals across the entire run. For a 50-part trial, measure every part. For a longer run, use a subgroup sampling plan — for example, five parts every 30 minutes.
Track these data points for every measurement:
- Dimension value against nominal
- Deviation from nominal
- Which machine and which operator
- Time of measurement
- Tool life at time of measurement (number of parts cut since last tool change)
When you plot this data, you will see the process story. Stable variation with no trend means the process is in control. A gradual drift means tool wear is happening faster than expected. A sudden jump means something changed — an operator, a tool, a machine parameter.
Tool Wear as the Hidden Variable
Tool wear is the most common cause of dimensional drift in CNC machining 6. As a cutting tool wears, it removes slightly less or more material per pass, depending on the geometry and the tool path strategy. This produces a slow, predictable shift in dimension over time.
A supplier who manages tool wear well will have:
- A documented tool life limit for each tool used on your part, in units of parts cut or machined time
- A scheduled tool change interval that replaces tools before they reach the failure point
- SPC data showing that dimensions remain stable after tool changes, confirming the replacement tool is set up correctly
Ask the supplier to show you the tool change log for your trial run. Cross-reference it with the SPC chart. You should be able to see where tool changes happened and confirm that the chart shows no step changes at those points.
In-Process Inspection vs. End-of-Line Inspection
There is a fundamental difference between these two approaches. In-process inspection means operators are measuring parts during the run and stopping the machine if a dimension drifts toward the control limit. End-of-line inspection means all parts are made first and then checked at the end.
End-of-line inspection cannot prevent defects. It can only find them after they exist. By the time an out-of-tolerance part is discovered at end-of-line, hundreds of similar parts may already have been made.
A supplier running genuine in-process inspection will have:
- Inspection records that show measurements taken at regular intervals during the run
- Evidence that production was paused or adjusted when a trend was detected
- SPC charts updated in real time, not reconstructed at the end of the shift
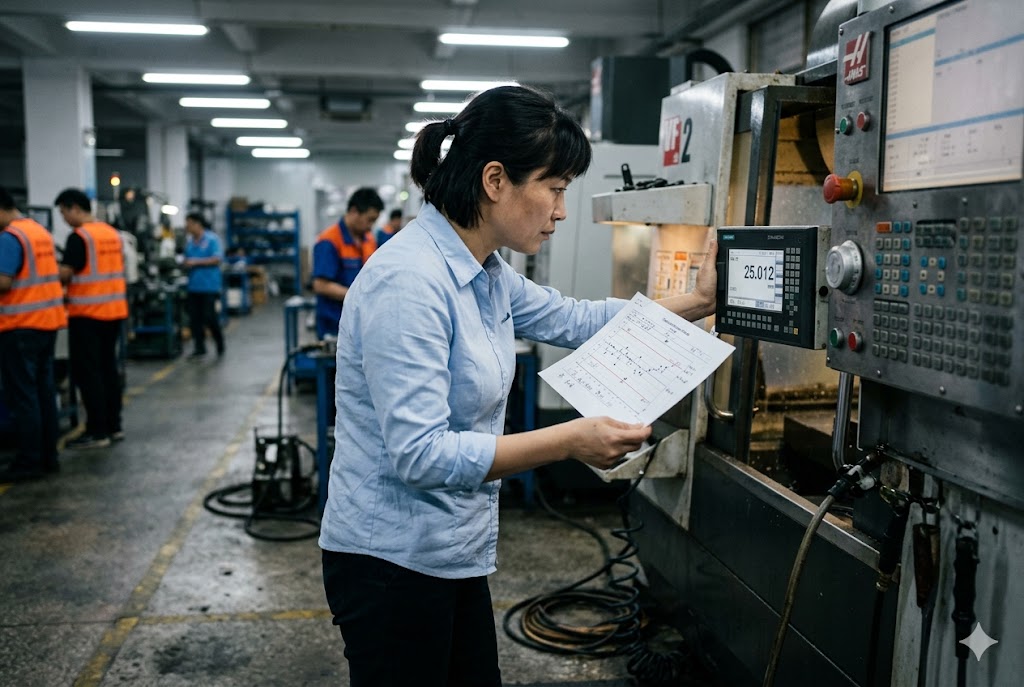
During a trial run, ask the supplier to let you observe in-process inspection in real time. What you see will tell you more about their quality culture than any certificate on the wall.
What Process Controls Should I Ask the Supplier to Document?
When our team conducts supplier audits for clients, we use a standard documentation checklist. Not because paperwork proves quality, but because documented controls are the only ones that are applied consistently. Undocumented controls depend on whoever is in the room that day.
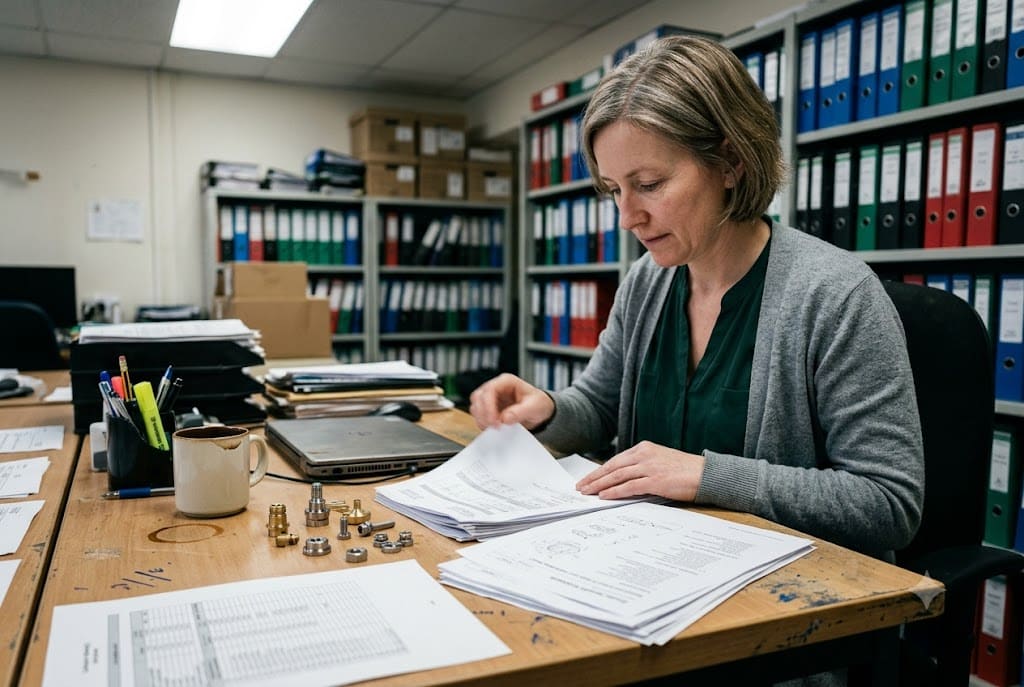
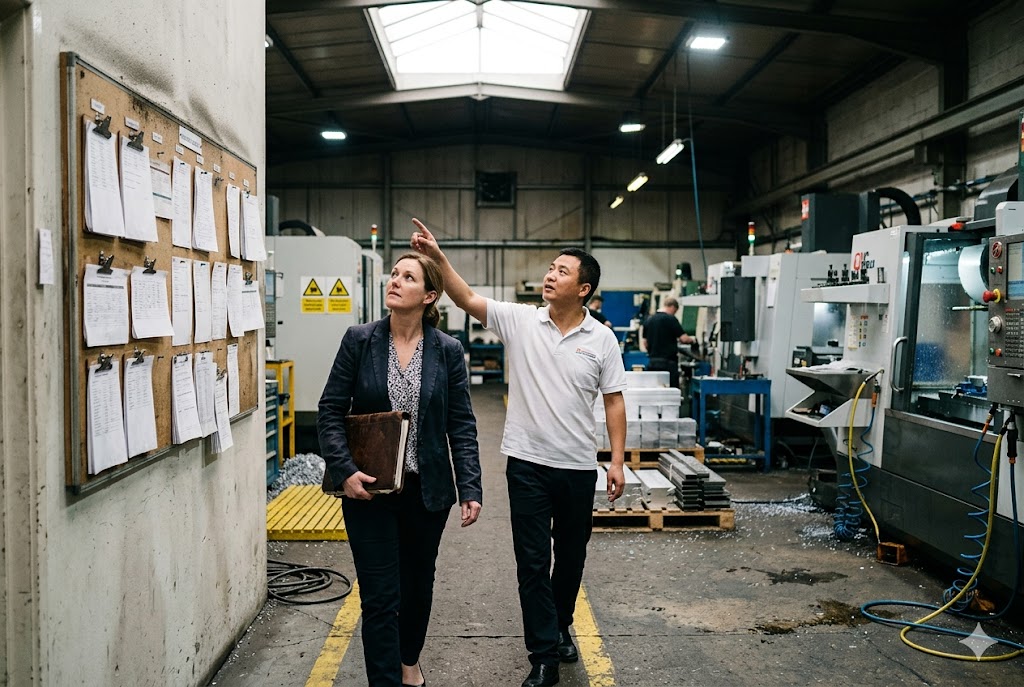
Ask the supplier to document machine calibration logs, tool change schedules, in-process inspection records with timestamps, nonconformance reports with corrective actions, material traceability records linking each batch to a heat number and machine ID, and operator qualification records for all personnel running your parts.
Machine Calibration and Maintenance Records
CNC machine accuracy degrades over time. Ball screws develop backlash. Encoders drift. Spindle bearings wear. Without periodic calibration and preventive maintenance 7, the machine's actual positioning accuracy can diverge significantly from its rated specification.
Ask to see:
- Calibration certificates for the specific machines running your parts, with dates and next-calibration due dates
- Preventive maintenance logs showing scheduled service intervals
- Calibration records for all measuring instruments used in inspection, with NIST traceability 8
If calibration stickers are expired or maintenance records are missing, the machine's accuracy is unknown. The supplier is operating on assumption.
Traceability: Your Root Cause Analysis Tool
Lot traceability 9 is not a bureaucratic requirement. It is the tool you use when something goes wrong six months into production. Without it, you cannot determine whether a field failure is isolated to one batch or systemic across all production.
Every shipped batch should be linkable to:
- Material heat number and material certification
- Machine ID and machine calibration status at time of production
- Operator name or ID
- Date and shift
- Inspection report with measured values
When a problem surfaces, this chain of records lets you answer one critical question: how many parts are affected? With good traceability, you pull one bad batch. Without it, you may have to recall everything.
Nonconformance Reports as a Quality Culture Signal
Here is a signal many buyers miss. Ask the supplier to show you their NCR log — their record of nonconformances and corrective actions 10 found during production — for the last six months. Look at the trend.
A supplier with a real quality culture will show you NCR logs where defect rates decline over time. Corrective actions are documented. Root causes are identified. The data shows continuous improvement.
A supplier who reports zero nonconformances across all production lots is not running a perfect process. They are either not measuring thoroughly, not recording honestly, or using a definition of nonconformance so narrow that almost nothing qualifies. All three possibilities are disqualifying.
Re-Audit Schedule
Process stability is not a one-time certification. Machines age. Operators change. Material suppliers shift. Tooling strategies drift. A process that was capable at qualification can quietly deteriorate over 12 months of production without a single dramatic failure to trigger an alert.
Build a re-audit schedule into your supplier agreements:
- 3-month check: review updated SPC charts and Cpk data for your critical dimensions
- 12-month audit: repeat the full qualification review including machine calibration, Gage R&R, and NCR log review
- Trigger-based audit: any field quality complaint or supplier-reported nonconformance triggers an immediate review
This schedule is not adversarial. A good supplier will welcome it because it protects their reputation as much as it protects your supply chain.
Conclusion
Process stability is confirmed through data, not promises. Request SPC charts, Cpk values, Gage R&R studies, traceability records, and maintenance logs before you approve any supplier for mass production. Audit again at three and twelve months. The data will tell you everything you need to know.
Footnotes
1. Overview of Statistical Process Control — its principles, charts, and role in manufacturing quality. ↩︎
2. Explanation of X-bar and R charts, how they are constructed, and how to interpret control limits. ↩︎
3. Definition and calculation of the Process Capability Index (Cpk) with industry benchmark values. ↩︎
4. Overview of First Article Inspection — what it covers and why it differs from a full process capability study. ↩︎
5. Full explanation of Gage R&R methodology, acceptance thresholds, and how to conduct a study. ↩︎
6. Introduction to CNC machining (numerical control) — how machines are programmed and how tool wear develops. ↩︎
7. NIST metrology resources covering calibration standards, measurement uncertainty, and best practices. ↩︎
8. NIST traceability program — how measurement results are linked to national and international standards. ↩︎
9. Manufacturing traceability concepts — linking finished goods back to materials, machines, and process records. ↩︎
10. Corrective and Preventive Action (CAPA) — the structured process for identifying root causes and preventing recurrence. ↩︎