Skip to main content Skip to footer
Every month we hear the same question: does SPC actually happen on the shop floor, or just on paper? Buyers who skip this check often get burned later.
Yes, SPC is used at many Chinese Swiss CNC factories, though the depth varies. Some shops run real-time control charts with valid Cpk data. Others only measure parts after the batch and call it SPC. The difference comes down to what the buyer requires in the contract.
Let's break down what real SPC looks like, what to ask for, and how it can save you time on inspection back home.
How Do I Request SPC Data From a Chinese Factory, and What Format Should the Control Charts Be In?
We get this question in almost every supplier audit call. Buyers ask for SPC data, then receive a single spreadsheet with no real numbers behind it.
Request SPC data as raw subgroup measurements exported directly from the CMM or digital gauge, not a finished chart. Ask for X-bar and R control charts, Cpk values per dimension, and timestamps showing when each subgroup was measured during the run.
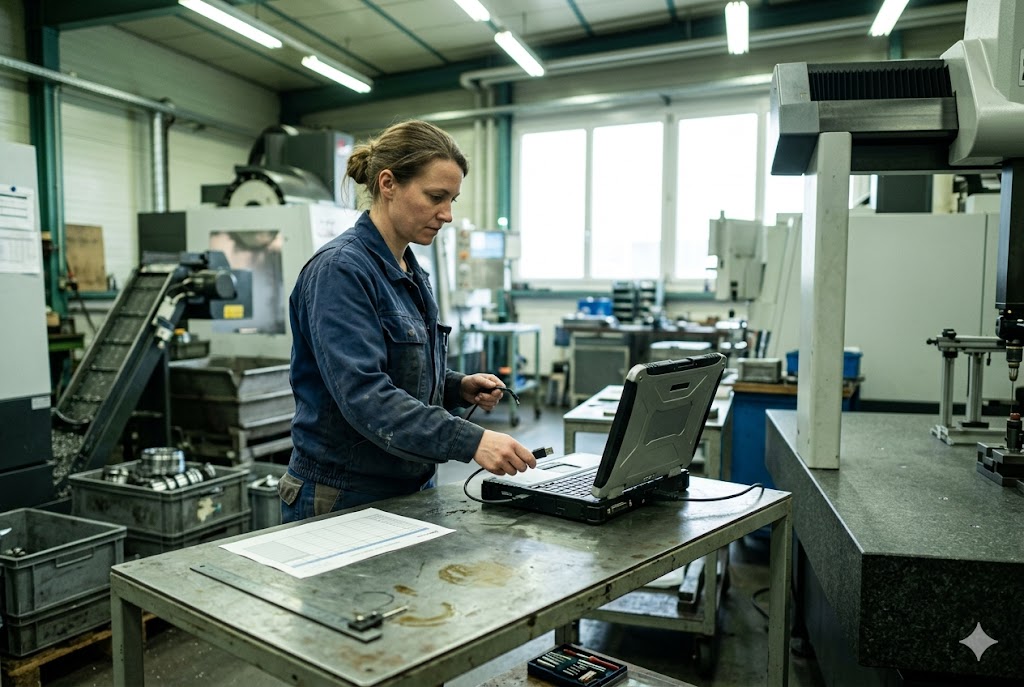
What a Real Control Chart Includes
A proper SPC chart is not just a line graph. It needs raw data behind it. When we audit a factory, we ask to see a live batch in production. We pick it at random. Then we ask for the control chart tied to that exact batch.
A real chart shows subgroup measurements taken at set intervals, not just numbers from the start and end of the run. Statistical process control 1 represents a shift away from post-production inspection toward continuous monitoring within manufacturing, using tools such as run charts, control charts, and design of experiments. If a factory only measures the first five parts and the last five parts, that is not process control. That is just inspection with extra steps.
Gage R&R Comes First
Before you trust any Cpk number, ask about Gage R&R. This stands for Gage Repeatability and Reproducibility. It checks if the measuring tool itself is reliable. Many Chinese Swiss CNC shops skip this step. Without it, every Cpk value on the chart is just a guess dressed up as data. Gage R&R studies 2 decompose measurement variation into its key components — part variation versus measurement system variation — helping manufacturers determine whether they are measuring actual differences between parts or merely seeing gauge inconsistencies. We always ask for Gage R&R below 10% on any gauge feeding an SPC chart. This should be a separate line item in your contract, not an assumption.
Watch for Faked Data
Some suppliers reuse one measured part across many subgroups. Others build charts from the nominal dimension on the drawing, not from real parts. The fix is simple. Ask for raw data exported directly from the CMM or digital gauge, with timestamps. If a supplier can only give you a clean PDF chart with no raw numbers, that is a warning sign.
Tie SPC to Payment
The most reliable way to get real SPC data is to link it to money. We tie the first production payment milestone to delivery of a compliant control plan and an initial SPC baseline study. This study should cover at least 25 subgroups, with Cpk at or above 1.33 on every drawing-critical dimension. Without this link, SPC paperwork tends to show up only when asked, not during actual production.
| SPC Data Format | What to Request | Why It Matters |
|---|---|---|
| Raw subgroup data | Exported CSV or CMM file | Shows real measurements, not summaries |
| Control charts | X-bar and R chart per dimension | Confirms process stays in control |
| Cpk values | Per critical dimension | Confirms tolerance margin |
| Timestamps | Date and time per subgroup | Confirms data was collected during the run, not after |
What Critical Dimensions on a Swiss-Turned Part Should Be Monitored With SPC During Production?
We see a pattern in supplier quality plans. They monitor the easy dimensions and skip the ones that actually cause rejects down the line.
The critical dimensions to monitor with SPC are outer diameter, bore diameter, thread pitch diameter, runout, and concentricity. These features drive fit and function on most Swiss-turned parts, yet suppliers often leave them off the SPC plan in favor of easier measurements.
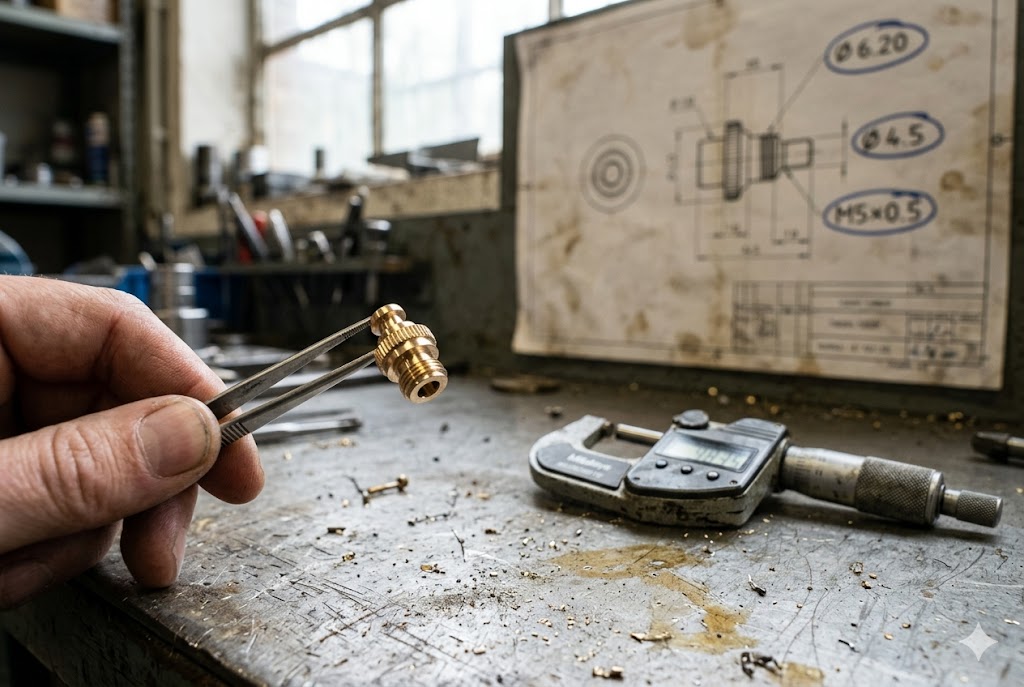
The Five Dimensions That Matter Most
Not every dimension on a drawing needs SPC monitoring. But some dimensions decide if the part works at all. On Swiss-turned parts, these are outer diameter, bore diameter, thread pitch diameter, runout, and concentricity. Swiss machining 3 is designed for small, intricate parts that require tight concentricity and minimal runout, achieving dimensional tolerances commonly ranging from ±0.0002 in to ±0.001 in depending on spindle accuracy, tooling rigidity, and thermal stability. These features control how the part fits with mating parts and how it performs under load.
Many supplier quality plans list dimensions that are simple to check, like overall length. They skip features that take more skill to measure, like concentricity. This is a problem because the easy dimensions rarely cause field failures. The hard ones do.
The Warm-Up Problem
Swiss-type lathes need time to stabilize after startup. The first 20 to 40 parts off the machine often run slightly different from the rest of the batch. This is normal. The machine and tooling are still settling into thermal balance.
The mistake happens when a factory blends this warm-up data into the main SPC baseline. This makes the control limits too wide. A control chart with wide limits will not catch a real problem later in the run. We always ask suppliers to flag or remove warm-up parts from the baseline calculation, not average them in.
Bar-Fed Tool Wear
Swiss turning often uses long bar stock fed through the machine. As a bar gets used up, tool wear increases. This shifts dimensions slowly across the bar length. When a new bar loads, the pattern resets.
Most Chinese Swiss CNC shops do not separate SPC data by bar load. This hides a real and known source of variation. A control plan should call out bar reload events by name and track dimension shift separately for each bar. Concentricity and runout 4 are among the most functionally important features in Swiss CNC machining — concentricity controls axis alignment while runout measures how much a surface deviates during rotation — and both require precise setup and tool alignment to maintain consistency across production runs.
| Dimension | Why It Matters | Common SPC Gap |
|---|---|---|
| Outer diameter | Affects fit with mating parts | Often monitored, but loosely |
| Bore diameter | Controls clearance and assembly | Sometimes skipped on small bores |
| Thread pitch diameter | Affects thread engagement | Rarely included in the SPC plan |
| Runout | Affects rotating performance | Frequently left off the plan |
| Concentricity | Affects balance and wear | Hardest to measure, most often skipped |
Can a Chinese Factory Provide Real-Time SPC Data During My Production Run?
Some factories say yes to this question before they even know what it takes. Then the data shows up late, or not at all.
Yes, some Chinese Swiss CNC factories can provide real-time SPC data, but capability varies widely. Shops that already serve Japanese or Taiwanese Tier-1 customers tend to have working systems in place. Many others only collect data after the batch ends and present it as if it were real-time.
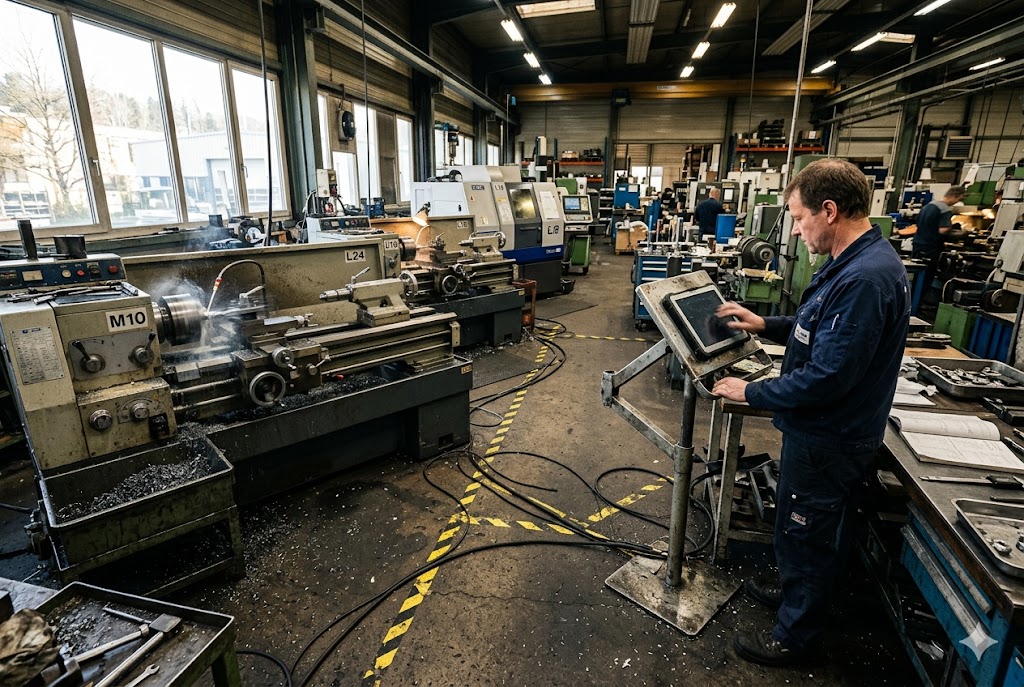
Capability Exists, But It Is Not Universal
Real SPC capability is out there. Factories holding AS9100 5, IATF 16949 6, or ISO 13485 7 certifications often have the equipment and training to run it. But having the certificate does not mean the factory uses SPC on every job. In our experience, deployment depends much more on what the customer demands in the contract than on the factory's own habits.
Spotting Inspection Theater
The most common version of fake real-time SPC is what we call inspection theater. A factory measures finished parts at the end of a batch. Then it plots those numbers on a control chart and calls it SPC. This is not the same as monitoring the process while it runs. Real SPC takes measurements during production, at set intervals, while the batch is still being made.
You can test this during a factory visit. Ask to see the control chart for a batch that is running right now, not one from last week. If the chart only has data clustered at the very start and very end, you are looking at inspection theater, not process control.
A Useful Shortcut: Customer History
One practical shortcut is to look at who else the factory supplies. Shops that already serve Japanese or Taiwanese Tier-1 customers tend to run tighter SPC systems. These customers often place resident engineers inside the factory and demand strict acceptance protocols. A factory that has survived this kind of scrutiny usually has SPC habits built into daily operations, not just paperwork built for an audit.
This history check will not replace a full audit. But it is a fast way to shortlist factories worth a closer look before you commit time to a deeper review.
| Signal | Real-Time SPC | Inspection Theater |
|---|---|---|
| When data is collected | Throughout the run | Only at start and end |
| Chart pattern | Even spread of subgroups | Clustered points |
| Source of data | CMM or digital gauge, live | Manual entry after the fact |
| Customer history | Often serves Tier-1 OEMs | Mostly serves price-driven buyers |
How Does SPC Implementation Reduce My Incoming Inspection Workload When Parts Arrive in the USA?
Every container that arrives without solid SPC backup means more work for your own QC team. That cost adds up fast across a year of orders.
Solid SPC implementation reduces incoming inspection workload because it shifts quality checks upstream, into the factory, before parts ship. With reliable Cpk data and verified gauges, you can move from inspecting every part to sample checks, freeing your team to focus on higher-risk shipments instead.

From 100% Inspection to Sample Checks
Most buyers start a new supplier relationship by checking every single part that arrives. This makes sense at first. You do not yet know if the factory is reliable. But 100% inspection is slow and expensive over time.
Once a factory proves Cpk at or above 1.33 8 on every critical dimension, run after run, you have evidence the process is stable. A Cpk of 1.33 means 99.994% of the product falls within specification, indicating a highly capable and well-centered process. At that point, you can move to sample inspection instead of checking every part. This frees up your QC team's time for shipments from newer or less proven suppliers.
Why the Gauge Matters as Much as the Chart
A control chart is only as good as the gauge behind it. If the factory has not run a Gage R&R study, you cannot trust the Cpk number, even if the chart looks clean. We always confirm GR&R below 10% before we accept any SPC data as a basis for reducing inspection. Skipping this step means you might be trusting noise, not real process control.
Linking SPC to Your Contract Terms
The best way to make this work long term is to write it into your purchase agreement. Require an SPC baseline study before the first payment milestone, and a minimum Cpk value on every drawing-critical dimension before reducing your inspection plan. This protects you if the factory's process drifts later in the relationship.
What This Looks Like in Practice
Buyers who transition from 100% inspection to AQL-based sampling 9 after verifying stable Cpk data can significantly reduce incoming inspection time and cost. The AQL framework, based on ISO 2859 standards, lets you define acceptable defect thresholds and sample sizes rather than checking every single part — but it only delivers reliable results when paired with solid upstream process control from your supplier.
| Inspection Stage | Without SPC | With Proven SPC |
|---|---|---|
| New supplier, first orders | 100% inspection | 100% inspection |
| After 3-5 stable runs | Still 100% inspection | Move to sample inspection |
| Ongoing orders | High inspection cost | Lower inspection cost, faster releases |
| Risk if process drifts | Caught late, after shipment | Caught early, inside the factory |
Over time, this saves real money. Your team spends less time on routine checks and more time on the orders that actually carry risk. X-bar and R charts 10 are the standard tool for tracking this stability over time: the X-bar chart shows whether the process mean is shifting while the R chart monitors whether within-subgroup variation is growing — giving you an objective basis for deciding when a supplier's process is reliable enough to reduce incoming inspection frequency.
Conclusion
SPC on Swiss-turned parts is real, but only when you ask for raw data, check the gauges, and tie it to your contract terms.
Footnotes
1. Overview of SPC as a continuous monitoring methodology using control charts and process improvement tools. ↩︎
2. Guide to Gage R&R studies, covering how measurement variation is separated from true part-to-part variation. ↩︎
3. Xometry's overview of Swiss machining tolerances, concentricity, and dimensional capabilities for precision parts. ↩︎
4. Explains the difference between concentricity and runout in Swiss CNC machining and why both require active SPC monitoring. ↩︎
5. NQA's overview of AS9100, the aerospace quality management standard that requires robust process control systems. ↩︎
6. Quality-One's guide to IATF 16949, the automotive QMS standard emphasizing defect prevention and process variation reduction. ↩︎
7. ISO's page on ISO 13485, the medical device quality management standard requiring validated production processes. ↩︎
8. Six Sigma Study Guide explanation of Cpk 1.33 as the widely accepted minimum threshold for a capable manufacturing process. ↩︎
9. QIMA's guide to AQL sampling based on ISO 2859, covering how to set defect thresholds and determine sample sizes for incoming inspection. ↩︎
10. Advantive's reference on X-bar and R charts, explaining how they track process mean and variation to assess long-term stability. ↩︎