Skip to main content Skip to footer
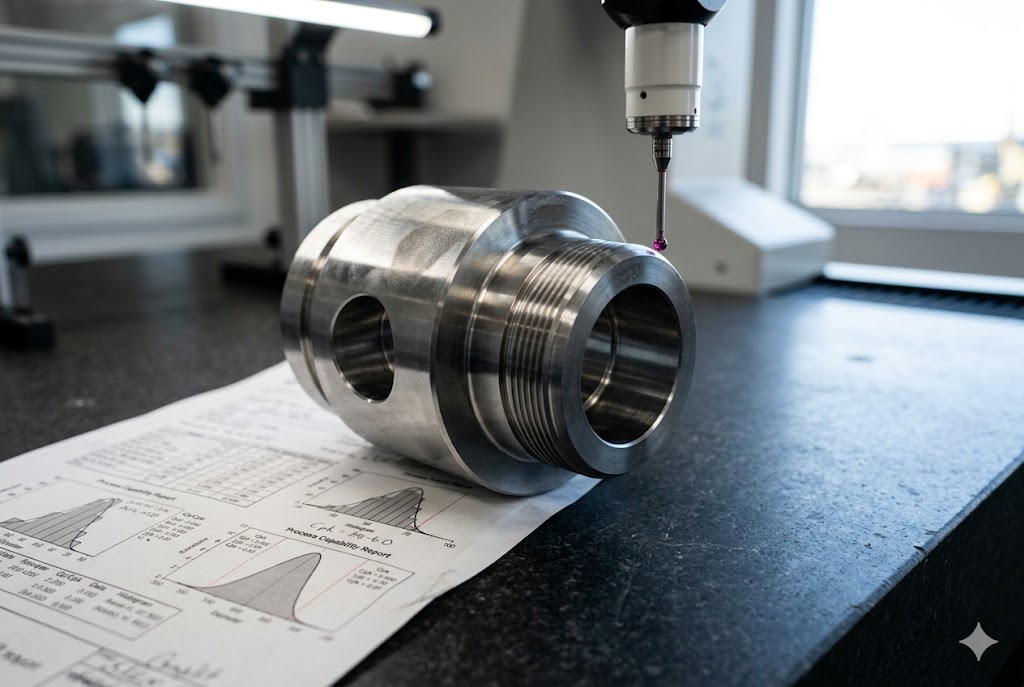
Every week our quality team hears the same question from US buyers: my supplier sent a Cpk number, but what does it mean for my parts?
Cpk, or Process Capability Index, measures how well a process fits within drawing tolerances by combining process centering and spread. A Cpk below 1.0 means the process is not capable, 1.0 to 1.33 is barely capable, and above 1.33 is capable. Most buyers should require a minimum of 1.33.
A number on a quote sheet means little without context. In the sections below, we break down what Cpk really tells you, what to put in your contract, and how to keep a supplier honest after approval.
What Minimum Cpk Value Should I Require in My Supplier Contract for Critical Swiss CNC Dimensions?
Our quality team has reviewed contracts with no Cpk requirement at all. That gap costs buyers real money once parts reach the production floor.
For critical Swiss CNC dimensions, such as mating bores or datum surfaces, your contract should require a minimum Cpk of 1.67. Non-critical features can use a Cpk of 1.33. Aerospace and medical parts often require 1.67 or higher, while standard parts use a 1.33 floor.

Most contracts we review ask for "good quality" but never name a number. That kind of language is too soft to enforce. Cpk gives you a figure you can write straight into a drawing note or quality plan, a figure the factory must hit before you accept the lot.
Not every dimension on a drawing carries the same risk. A bore that controls fit with a customer's assembly is not the same as a cosmetic edge. Our engineers always split a drawing into critical and non-critical features before setting any Cpk target. Critical features get the higher bar, and non-critical features get a lighter one.
Set Cpk by Feature Criticality, Not One Blanket Number
We tell every new Swiss CNC supplier the same thing. Critical dimensions need a Cpk of 1.67 or higher. These are the bores, threads, and datum surfaces that affect fit, function, or safety. Non-critical features, like a chamfer or a cosmetic radius, can run at a process capability index 1 of 1.33. This split keeps your contract realistic. A blanket 1.67 requirement on every single dimension wastes the supplier's time and raises your part cost, since some features simply do not need that level of control.
Industry Standards Give You a Starting Point
Different industries already set the bar for you. Aerospace and medical device buyers usually require a Cpk of 1.67 or higher, often targeting 2.0 for flight-critical or implantable parts. Automotive safety parts also sit at 1.67, while standard automotive components run on a 1.33 floor. Nuclear and other safety-critical work pushes past 2.0. Use the table below as your starting point, then adjust up or down based on your own part's risk.
| Industry or Application | Minimum Cpk Required | Typical Target |
|---|---|---|
| Standard mechanical parts | 1.33 | 1.33–1.50 |
| Standard automotive components | 1.33 | 1.33–1.50 |
| Automotive safety-related parts | 1.67 | 1.67–2.00 |
| Aerospace components | 1.67 | 2.00+ |
| Medical devices | 1.67 | 2.00+ |
| Nuclear or safety-critical parts | 2.00 | 2.00+ |
Write your number directly into the drawing note or the quality plan, not just in an email thread. A supplier who signs a purchase order with a stated Cpk floor has a much harder time arguing about a failed lot later. The Production Part Approval Process (PPAP) 2 formalizes exactly this kind of upfront capability commitment for regulated industries.
How Do I Ask a Chinese Factory to Provide Cpk Data for a Key Dimension in Their Quote?
Our project managers get vague Cpk numbers from suppliers all the time. A number with no source behind it is just a guess dressed up to look scientific.
Ask the factory for Cpk data collected from an actual production run of your part, in your material, using your drawing tolerances, not a generic machine capability study. Request the raw measurement data, sample size, and gauge used, along with the final Cpk number itself.

When a quote comes back with a Cpk figure but no backup data, our team sends it right back before we forward it to the client. A number with no source is not worth much. We have seen suppliers reuse the same Cpk figure across several quotes for different parts, which is a clear sign the number was never tied to your actual drawing.
Ask for Real Production Data, Not Equipment Specs
Many factories run a machine capability study using a test bar, then quote that same Cpk for your actual part. This is a common shortcut, and it almost always overstates real capability. Your part has its own geometry, fixture, and material behavior. Ask the supplier directly for Cpk data from an actual production run of this drawing, in this material, not a general machine test. One clear sentence in your RFQ template filters out suppliers who cannot back up their claims with real numbers. If a supplier cannot produce this kind of data within a reasonable time, that delay itself tells you something about their quality system.
Check the Sample Size Before You Trust the Number
A Cpk built from ten parts is not reliable. Natural variation in a small batch can push the number up or down by a wide margin. Ask for at least fifty consecutive measurements from one continuous production run before you accept a Cpk submission for first article inspection 3 approval. Anything less is a rough guess, not a real capability study. If a supplier pushes back on this simple request, treat that pushback as a warning sign rather than a minor inconvenience.
| Item to Request | Why It Matters |
|---|---|
| Raw measurement data | Shows the actual readings, not just one final figure |
| Sample size and dates | Confirms the data comes from a real, recent production run |
| Material and lot used | Confirms it matches your specification, not a substitute alloy |
| Gauge or instrument used | Confirms the measurement method is accurate and traceable |
| Process conditions | Confirms stable, normal production, not a special test setup |
Use this checklist in your RFQ template so every supplier answers the same questions in the same format. That makes quotes easier to compare side by side. Insisting on a Gage R&R study 4 alongside the Cpk submission confirms that the measurement instrument itself is not adding hidden variation to the numbers.
What Does a Cpk Below 1.33 Mean for My Production Yield and Scrap Risk?
Our engineers ran the numbers on a supplier sample last year. A Cpk of 1.1 was quietly creating scrap that the supplier never reported.
A Cpk below 1.33 signals a process near four sigma or worse, which means more scrap and rework than a healthy supplier should produce. Below 1.0, the process is not capable and will create defects on a regular basis. Each drop in Cpk raises your cost and delivery risk.
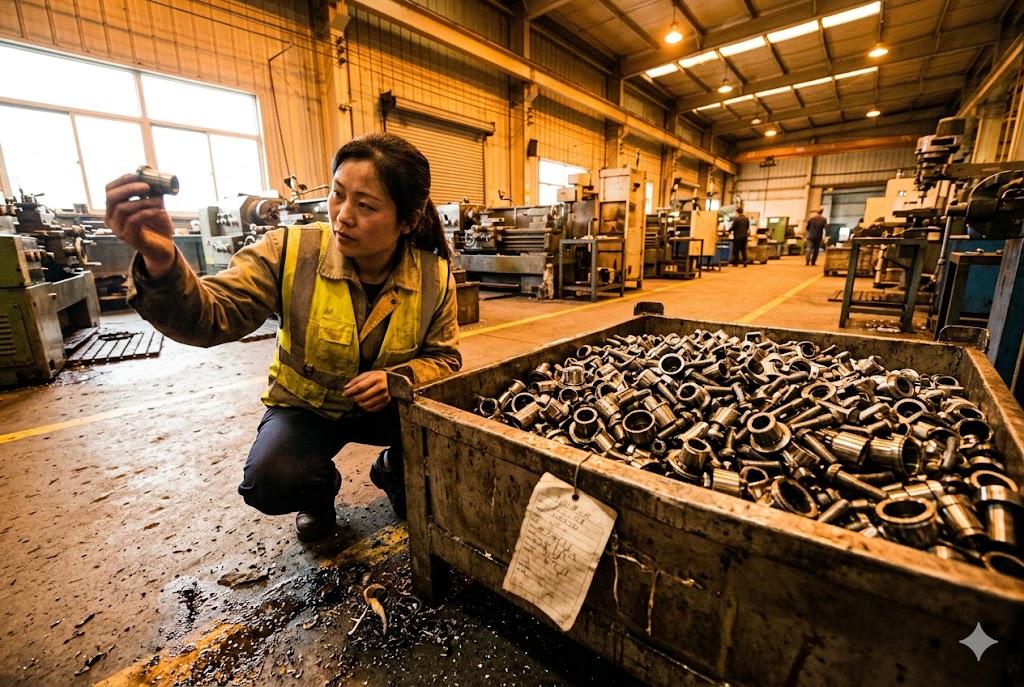
The link between Cpk and defects is not a straight line. A small drop in Cpk near the low end of the scale creates a much bigger jump in defects than the same drop near the high end. This is why a Cpk of 1.1 feels closer to 1.0 than to 1.33 in real production results.
From Cpk to Defects: The Math Behind the Number
Statisticians connect Cpk to a sigma level and an expected defect rate, often written as defects per million opportunities 5, or DPMO. The table below shows the standard reference points used across most manufacturing industries.
| Cpk | Sigma Level | Approx. DPMO | Approx. Yield |
|---|---|---|---|
| 1.00 | 3σ | 2,700 | 99.73% |
| 1.33 | 4σ | 63 | 99.9937% |
| 1.67 | 5σ | 0.57 | 99.999943% |
| 2.00 | 6σ | 0.002 | 99.9999998% |
A jump from a Cpk of 1.0 to 1.33 cuts your expected defect rate by more than forty times. That is not a small improvement. It is the difference between routine scrap and a process you can trust to ship without heavy inspection. A guide to process capability indices Cp and Cpk 6 explains how the two measures differ and why you should always use Cpk rather than Cp alone when assessing real production output.
Why a Small Cpk Drop Costs You More Than You Think
A low Cpk does not just mean more scrap on the factory floor. It means more rework hours, more inspection time, and a higher chance that a bad part slips through and reaches your customer. For buyers managing downstream production lines, a late shipment caused by a scrap problem can stop an assembly line and trigger compensation claims. A Cpk just under 1.33 might look close enough on paper, but in real production it behaves much closer to a process with no real margin at all. We always ask new suppliers to show their Cpk trend over several months, not just one snapshot, because a single good number can hide a process that is sliding in the wrong direction.
Can a Factory Improve Its Cpk Over Time as It Accumulates Production Data on My Part?
Our clients often ask if a low first-run Cpk is a deal breaker. In our experience, the answer depends on what the supplier does after that first run.
Yes, a factory's Cpk can improve as it gathers more production data and tightens process control. Early Cpk estimates from a limited run are not final. Require ongoing SPC data and re-qualification at set intervals to confirm real, sustained improvement, not a one-time lucky batch.

Cpk cannot be calculated with full accuracy before real production starts. Early figures from a pilot run or a small first batch are estimates, not guarantees. As a factory runs more parts, fixes tooling issues, and tightens its process, the real Cpk often rises. The opposite can also happen if a process drifts and nobody catches it in time.
Why Cpk Needs Production Data, Not Just Estimates
Before mass production begins, a factory can only offer an estimated Cpk based on similar parts or historical data from comparable processes. This is normal and expected at the quoting stage. Once real production starts, ask for updated Cpk figures from your actual part, not the original estimate. A factory that refuses to update its numbers after several hundred parts is hiding something, or simply not tracking its own process. Swiss CNC machining 7 introduces unique geometry constraints — slender bar stock and guide bushings — that make early capability estimates especially sensitive to fixture and tooling conditions, so post-production Cpk updates are particularly important for these parts.
Build a Monitoring Schedule That Catches Drift Early
A Cpk value is a snapshot, not a guarantee. A process that passes first article inspection can still drift weeks later from tool wear, material changes, or operator turnover. Require the factory to submit SPC charts 8 on a fixed schedule, then tie your approval for continued mass production to keeping the Cpk above your contract floor.
| Production Stage | Sample Size | Action Required |
|---|---|---|
| First article | 50+ consecutive pieces | Calculate initial Cpk, approve or reject |
| Early production | Every 500 pieces | Update Cpk, watch for early drift |
| Ongoing mass production | Monthly SPC review | Confirm Cpk stays above the contract floor |
| Process or tooling change | New 50-piece study | Re-qualify before resuming shipment |
This kind of schedule turns Cpk from a one-time number on a quote into a living part of your quality program. Buyers who skip this step often only discover a drifting process after a shipment fails inspection, which is the most expensive way to find out. For OEMs managing sub-tier supplier chains, supplier SPC monitoring platforms 9 can stream control chart data in real time so buyers see process drift before a bad lot ships. When the monitoring schedule detects a sustained drop, a formal re-qualification study following PPAP guidelines 10 gives you a documented path back to approved status rather than an informal email exchange.
Conclusion
Cpk gives you a real number to hold your supplier accountable. Set it by feature, ask for real data, and keep watching it after approval.
Footnotes
1. How Cp and Cpk differ and why both matter for assessing manufacturing process centering. ↩︎
2. Overview of PPAP, the standardized supplier approval process used across automotive, aerospace, and medical manufacturing. ↩︎
3. What a First Article Inspection covers and when buyers require it from suppliers. ↩︎
4. ASQ reference on Gage R&R studies for verifying measurement system accuracy and repeatability. ↩︎
5. How DPMO connects sigma levels to real defect rates in manufacturing processes. ↩︎
6. Guide explaining when to use Cpk versus Cp and how each is calculated for production lots. ↩︎
7. How Swiss CNC machining achieves tight tolerances and what constraints affect early capability estimates. ↩︎
8. ASQ definition and application of Statistical Process Control charts in manufacturing quality programs. ↩︎
9. How real-time SPC software platforms give buyers visibility into supplier process stability across supply chains. ↩︎
10. All 18 PPAP elements explained, including Cpk thresholds and action plans for characteristics between 1.33 and 1.67. ↩︎